Debugging is the act of finding and fixing current and potential flaws (often known as “bugs”) in software code that might cause it to behave abnormally or crash. Debugging detects and fix bugs or problems in software or systems to prevent them from malfunctioning.
It becomes more difficult when several subsystems or modules are tightly connected. As each modification in one module may cause more bugs to arise in another. Debugging a program can take longer than programming it.
To debug a software, the user must first identify the problem, isolate the source code, and then correct it. Because knowledge of problem analysis is expected, a user of a program must know how to fix the problem.The software will be ready to use after the bug has been repaired. Debugging tools (sometimes known as debuggers) detect coding mistakes at various stages of development. They recreate the error conditions. Then look at the program state at the moment to figure out what went wrong.
Programmers can follow the execution of a program step by step by assessing the value of variables and stopping it if necessary to obtain the value of variables or reset program variables. Some programming language packages include a debugger. It can check for flaws in the code.
Here’s the debugging process:
1. Reproduce the problem.
2. Describe the bug. Try to get as much input from the user to get the exact reason.
3. Capture the program snapshot when the bug appears. Try to get all the variable values and states of the program at that time.
4. Analyse the snapshot based on the state and action. Based on that try to find the cause of the bug.
5. Fix the existing bug, but also check that any new bug does not occur.
Top 11 debuggers to know in 2021
1. GDB (The GNU Debugger)

GBD’s main advantage is that it permits remote debugging. For example, suppose you’re managing a server orchestration and one of them goes down.
You’re not sure why, and you need to look within.
GBD enables you to debug a program on your machine against one that is executing on a distant machine.
The ability to place breakpoints for inspection, step through processes, and examine variables are among the debugging tools.
There is no graphical user interface in the GDB. While this may appear strange when compared to more current debuggers, GDB operates on the command line, which is a familiar environment for many developers working on server-side and backend projects and is aligned with the languages supported by the GNU Debugger.
2. Lightrun

Lightrun is a server-side debugger for microservices, Kubernetes, Docker swarms, and Amazon web services that allows you to run tests and diagnostics.
What sets Lightrun apart is that debugging may take place in real time, right on the service as it runs. To remedy the problem, there’s no need to try to replicate or construct mirror servers. There is no downtime when deploying Lightrun, which helps to keep the bug or issue in its original state.
This is advantageous to developers since it saves us time by providing us with the information we require at the time we require it without interfering with our services. Lightrun’s debugging features include the ability to add log lines, metrics, and snapshots directly from your IDE. You can debug your live server with Lightrun without stopping it.
3. Fusion Reactor

Fusion Reactor is a multi-channel alert integration solution that provides continuous monitoring, profiling, and live debugging. It has a comprehensive set of capabilities that can assist you in finding flaws, leaks, and spikes more quickly and efficiently.
Live debugging allows you to examine code stacks as they execute, which is useful for tracking and tracing logs in real time. When debugging, we’re frequently compelled to put the code on hold in order to figure out what’s going on. This can distort the outcome and assist the bug elude us, depending on how it’s done.
Error pointing in Fusion Reactor is tailored to Java and ColdFusion, and non-blocking breakpoints can against the code for a complete stack trace report.
This means you can monitor, watch, track, and trace server processes without disturbing them.
If you have distributed systems or use a microservice design, being able to debug without interruptions is crucial for identifying the root of the problem.
4. Interactive Disassembler
The Interactive Disassembler (IDA) is a piece of software that allows you to decompile machine-executable code into assembly language source code.
This can be beneficial for debugging programs that have already been compiled and when the source code isn’t readily available.
IDA Pro is the commercial version of Interactive Disassembler, and it includes all of the most up-to-date features and functionalities. Older versions are still free to download.
Without having to repeatedly go through the compilation process, IDA allows you to cross-reference code sections, track arguments, and API calls. Rather than having to reset the system every time you want to add a log, you gain access to pieces of data and the ability to rename, annotate, and add information to parts of the code.
5. Ghidra

Ghidra is a free program (by the National Security Agency (NSA)) that allows users to reverse engineer software to its original source code. It’s a full-featured SRE framework with built-in code mining.
This is a unique tool since it can assist you in tracking down and patching vulnerabilities in your systems.
Ghidra isn’t your average debugging program. Through actions of disassembly, assembly, decompilation, graphing, and scripting, it can be used as a source tracking tool.
6. Valgrind
Valgrind is a memory management debugging tool that allows you to profile your applications on both a software and hardware level.
It keeps track of how your software consumes and utilizes hardware, allowing you to detect and resolve memory leaks more quickly. Memory assignment tracking, stray uninitialized values, mismatched frees, heap blocks, and overlapping source and destination memory blocks are all examples of this.
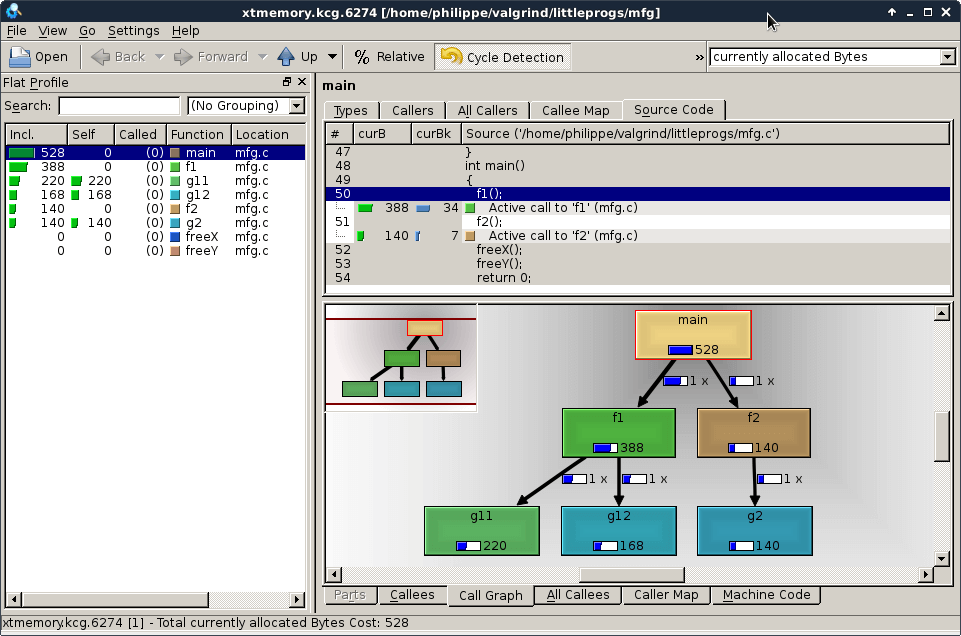
Valgrind has the advantage of being open-source software, which means it is free to use and integrate into production servers. It supports a variety of Linux-based platforms as well as a side of Android for debugging mobile hardware.
7. PurifyPlus
PurifyPlus is a tool for analyzing data in real time. This means it monitors the system in real time, keeping an eye on CPU allocations and any other potential bottlenecks in the program.
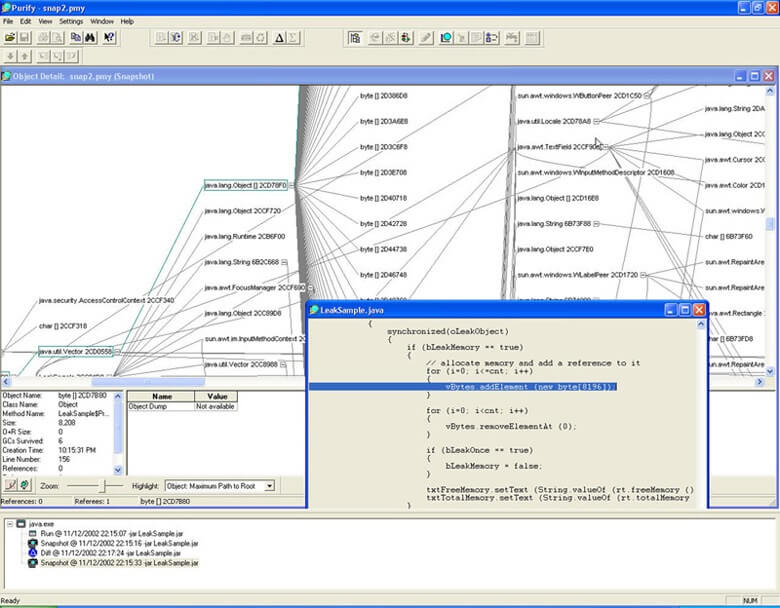
So, how does PurifyPlus debugging work?
Because this is a run-time debugger, you’ll be able to view the problem as it happens rather than trying to recreate and debug it later. This means you may install PurifyPlus on your server and have it monitor your systems and provide you with analytical insights as needed.
8. LLDB
The LLDB debugger for macOS is the default debugger and supports C, Objective-C, and C++ for desktop and iOS devices. This debugger also contains modifications that allow it to be scripted in Python. If you’re familiar with GBD, the command syntax is structurally comparable, and you may use what you already know.
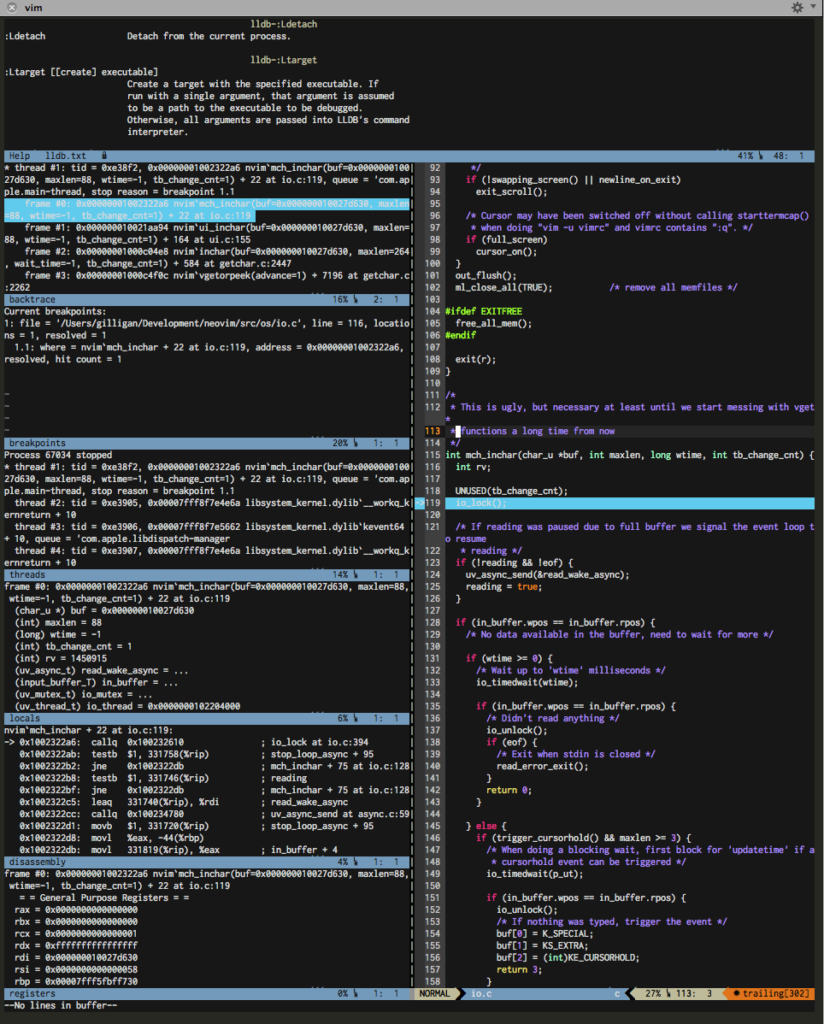
It has a built-in command-line tool, remote debugging, and disassembly capabilities.
This enables you to debug your code without having to recompile it every time you run it.
Because it is memory efficient, you can use the data logs as part of your debugging investigation without affecting your hardware.
9. Affinic Debugger
Breakpoints, insertion tools, and disassembly are all available in Affinic Debugger, as are other debugger functions.
The fact that Affinic Debugger is built to function with an interface is what sets it apart.
As a result, if you’re not used to debugging through the terminal, Affinic Debugger provides a UI-friendly alternative.
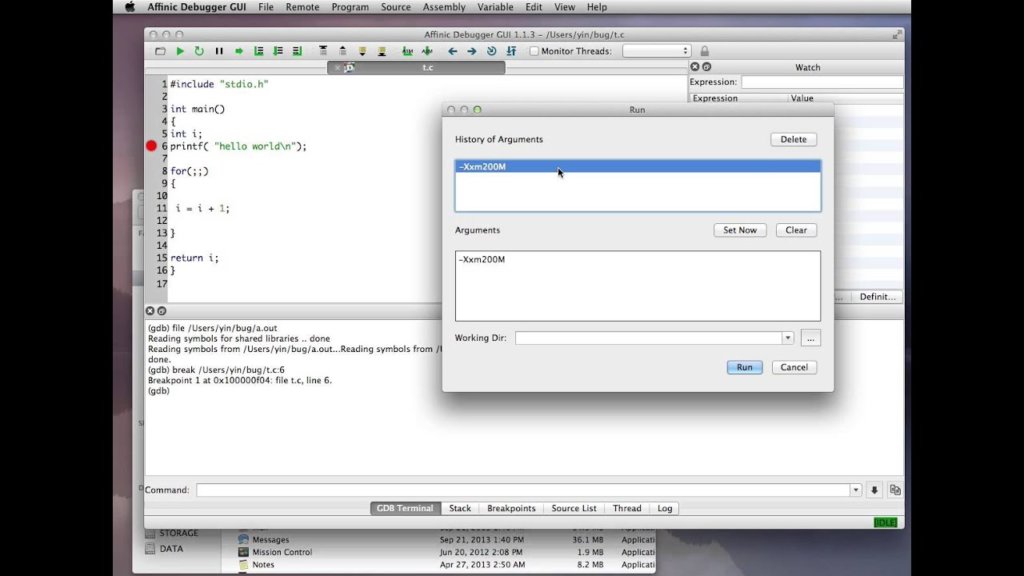
This means that instead of trying to figure out the proper commands in a console, you may access debugging operations for a toolbar. With breakpoints and commands, the graphical interface allows you to trace your code and offer memory-based historical data.
Affinic Debugger can also be useful for conjunction with GDB and LLDB. This means you may use both to get a more detailed picture of what’s going on behind the scenes of your applications.
10. Sentry
![]()
Sentry is a monitoring software that allows you to track your code’s performance over time. It runs in the background, polling your software diagnostics and allows you to keep logs in case something goes wrong.
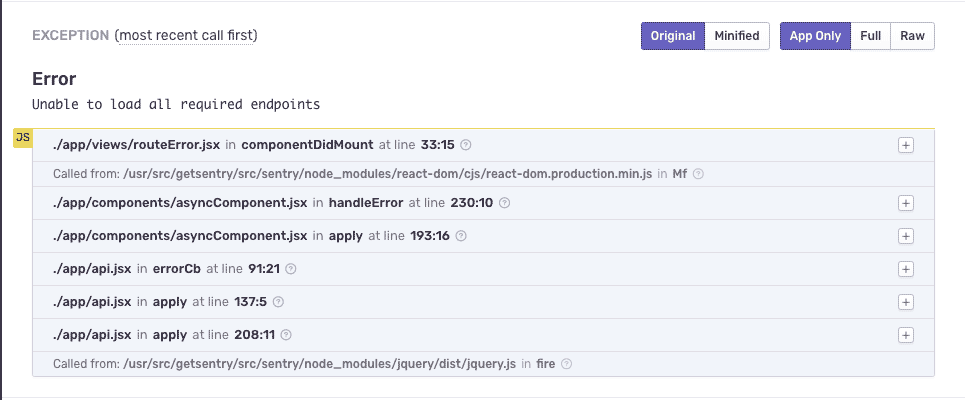
Sentry can be used at any level of your application, including the frontend, backend, and distributed servers.
It will do automatic logging with breadcrumb events that will allow you to track down issues and their causes.
Errors can also be tracked back to certain versions, allowing you to determine whether or not a modification is the source of the problem.
11. SmartBear AQTime Pro

SmartBear AQTime Pro is an upgraded debugging tool that resides inside your Visual Studio IDE and allows you to track your project from compilation to run-time.
The main distinction between AQTime Pro and the other debuggers is that it is comfortable for Visual Studio.
This indicates that the debugging tools and controls are user-friendly. It includes all main programming languages, such as C and C++,.NET, and Delphi. Most debuggers are less graphically interactive than AQTime Pro.
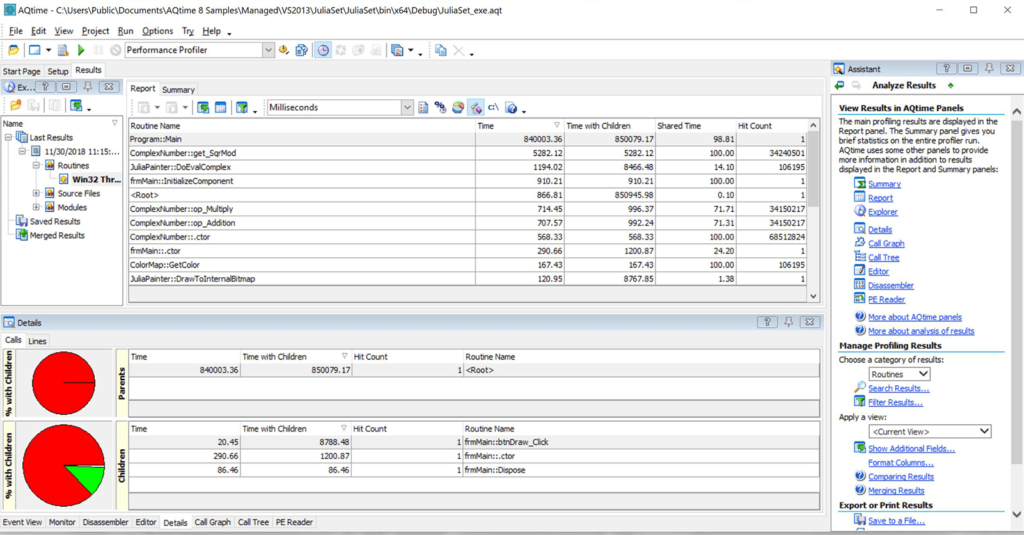
It also comes equipped with the ability to export logs and profile runs into various formats such as Excel, HTML, XML, or text files.
Click here to read more useful and interesting.
Pretty! This was a really wonderful article. Thanks for providing these details.