
The top command is one of the most basic commands for monitoring processes on Linux. It displays the top processes depending on factors such as cpu or memory consumption, as the name implies.
Processes are listed in a table with numerous columns for information such as process name, pid, user, cpu utilization, and memory consumption.
Aside from displaying a list of processes, the top command also displays brief statistics such as average system load, CPU use, and RAM consumption.
This tutorial will show you how to use the top command to monitor processes on your linux computer or server in a few easy examples.
Note your “top” command variant
Be aware that there are several variations of the top command. Each with a somewhat different set of arguments and methods of execution.
Use the -v option to examine the version and variation of your top command.
$ top -v
  procps-ng version 3.3.9
The top command from the procps-ng project is the subject of this post. This is the version that most contemporary distros, such as Ubuntu, Fedora, and CentOS, use.
1. Display processes
To get a glimpse of the running processes, just run the top command as is without any options like this.
$ top
And immediately the output would be something like this –
top - 18:50:35 up  9:05,  5 users,  load average: 0.68, 0.52, 0.39
Tasks: 254 total,   1 running, 252 sleeping,   0 stopped,   1 zombie
%Cpu(s):  2.3 us,  0.5 sy,  0.0 ni, 97.1 id,  0.2 wa,  0.0 hi,  0.0 si,  0.0 st
KiB Mem:   8165300 total,  6567896 used,  1597404 free,   219232 buffers
KiB Swap:  1998844 total,        0 used,  1998844 free.  2445372 cached Mem
  PID USER      PR  NI    VIRT    RES    SHR S  %CPU %MEM     TIME+ COMMAND
17952 enlight+  20   0 1062096 363340  88068 S   4.8  4.4   0:49.33 chrome
14294 enlight+  20   0  954752 203548  61404 S   2.1  2.5   2:00.91 chrome
 1364 root      20   0  519048 105704  65348 S   0.6  1.3  17:31.27 Xorg
19211 enlight+  20   0  576608  47216  39136 S   0.6  0.6   0:01.01 konsole
   13 root      rt   0       0      0      0 S   0.3  0.0   0:00.10 watchdog/1
   25 root      20   0       0      0      0 S   0.3  0.0   0:03.49 rcuos/2
 1724 enlight+  20   0  430144  36456  32608 S   0.3  0.4   0:03.60 akonadi_contact
 1869 enlight+  20   0  534708  52700  38132 S   0.3  0.6   0:53.94 yakuake
14040 enlight+  20   0  858176 133944  61152 S   0.3  1.6   0:09.89 chrome
A lot of information regarding the system is on the screen. Uptime, load average, CPU utilization, and memory usage data are all included in the header regions.
The process list shows all the processes with various process specific details in separate columns.
Some of the column names are pretty self explanatory.
PID – Process ID
USER – The system user account running the process.
%CPU – CPU usage by the process.
%MEM – Memory usage by the process
COMMAND – The command (executable file) of the process
2. Sort by Memory/Cpu/Process ID/Running Time
Sort the list to identify the process that uses the most CPU or memory.
To order the process list by memory consumption, press the M key (yes, capital, not small). The processes that use the most RAM are presented first, followed by the others in order.
Here are other options to sort by CPU usage, Process ID and Running Time –
- ‘P’ – to sort the process list by cpu usage.
- ‘N’ – to sort the list by process id
- ‘T’ – to sort by the running time.
3. Reverse the sorting order – ‘R’
The sorting is in descending order by default. By pressing ‘R,’ the sorting order of the presently sorted column will be reversed.
Here’s the output, ordered by CPU consumption in ascending order. The processes that use the least amount of CPU are displayed first.
top - 17:37:55 up  8:25,  3 users,  load average: 0.74, 0.88, 0.74
Tasks: 245 total,   1 running, 243 sleeping,   0 stopped,   1 zombie
%Cpu(s):  5.2 us,  1.7 sy,  0.0 ni, 93.2 id,  0.0 wa,  0.0 hi,  0.0 si,  0.0 st
KiB Mem:   8165300 total,  6089388 used,  2075912 free,   199060 buffers
KiB Swap:  1998844 total,        0 used,  1998844 free.  1952412 cached Mem
  PID USER      PR  NI    VIRT    RES    SHR S  %CPU %MEM     TIME+ COMMAND
    1 root      20   0  185308   6020   4012 S   0.0  0.1   0:01.90 systemd
    2 root      20   0       0      0      0 S   0.0  0.0   0:00.00 kthreadd
    3 root      20   0       0      0      0 S   0.0  0.0   0:00.16 ksoftirqd/0
    5 root       0 -20       0      0      0 S   0.0  0.0   0:00.00 kworker/0:+
    7 root      20   0       0      0      0 S   0.0  0.0   0:06.98 rcu_sched
    8 root      20   0       0      0      0 S   0.0  0.0   0:00.00 rcu_bh
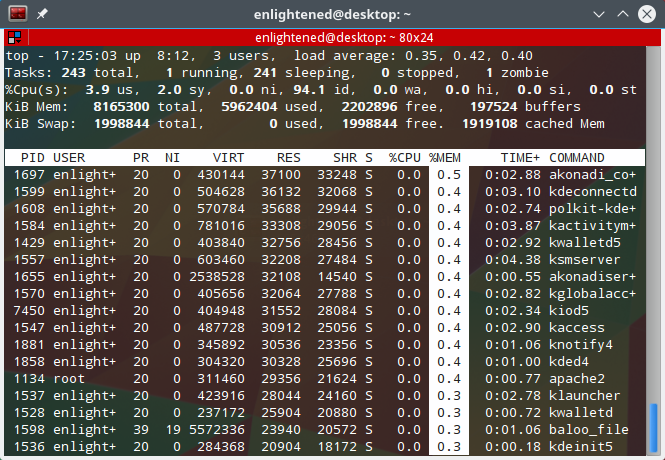
4. Highlight the sorted column with bold text – ‘x’
To highlight the values in the sort column in bold text, press x. Here’s an example of a snapshot with the memory column highlighted in bold language –
5. Highlight sorted column background color ‘b’
It’s also possible to highlight the sorted column with a different backdrop color after highlighting it with bold font. This is how it seems.
6. Change the update delay – ‘d’
By default, the top command refreshes the information on the screen every 3.0 seconds. This refresh interval is adjustable.
Top will ask you to input the time interval between each refresh if you press the ‘d’ key. You can also input fractions of a second, such as 0.5. Hit Enter after entering the appropriate interval.
top - 18:48:23 up  9:19,  3 users,  load average: 0.27, 0.46, 0.39
Tasks: 254 total,   1 running, 252 sleeping,   0 stopped,   1 zombie
%Cpu(s):  1.3 us,  0.4 sy,  0.0 ni, 98.1 id,  0.2 wa,  0.0 hi,  0.0 si,  0.0 st
KiB Mem:   8165300 total,  7899784 used,   265516 free,   238068 buffers
KiB Swap:  1998844 total,     5432 used,  1993412 free.  3931316 cached Mem
Change delay from 3.0 to
  PID USER      PR  NI    VIRT    RES    SHR S  %CPU %MEM     TIME+ COMMAND
14512 enlight+  20   0 1047688 302532  87156 S   1.3  3.7   1:34.87 /opt/googl+
15312 enlight+  20   0   25148   3280   2628 R   0.8  0.0   0:00.04 top
7. Filter or Search processes – ‘o’/’O’
You can use several parameters to filter the process list, such as process name, memory utilization, and CPU usage. There are multiple filter criteria that can be used.
Press the ‘o’ or ‘O’ to activate filter prompt. It will show a line indicating the filter format like this –
add filter #1 (ignoring case) as: [!]FLD?VAL
Then enter a filter like this and hit Enter.
COMMAND=apache
Now top will show only those processes whose COMMAND field contains the value apache.
Here is another filter example that shows processes consuming CPU actively –
%CPU>0.0
See active filters – Press Ctrl+o to see currently active filters
Clear filter – Press ‘=’ key to clear any active filters
8. Display full command path and arguments of process – ‘c’
In the COMMAND column, press ‘c’ to see the full command path as well as the commandline parameters.
%CPU %MEM     TIME+ COMMAND
  0.0  0.0   0:00.00 /usr/bin/dbus-launch --exit-with-session /usr/bin/im-laun+
  0.0  0.1   0:01.52 /usr/bin/dbus-daemon --fork --print-pid 5 --print-address+
  0.0  0.3   0:00.41 /usr/bin/kwalletd --pam-login 17 20
  0.0  0.0   0:00.00 /usr/lib/x86_64-linux-gnu/libexec/kf5/start_kdeinit --kde+
  0.0  0.3   0:01.55 klauncher [kdeinit5] --fd=9
  0.0  0.2   0:00.13 /usr/lib/telepathy/mission-control-5
  0.0  0.1   0:00.00 /usr/lib/dconf/dconf-service
  0.0  0.4   0:01.41 /usr/lib/x86_64-linux-gnu/libexec/kdeconnectd
  0.0  0.2   0:01.09 /usr/lib/x86_64-linux-gnu/libexec/kf5/kscreen_backend_lau+
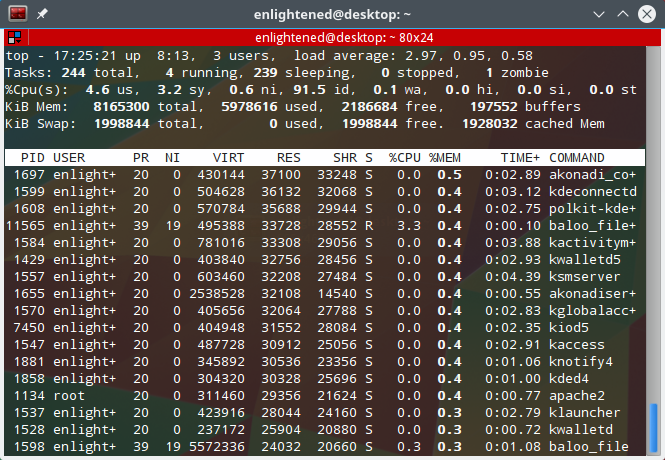
9. View processes of a user – ‘u’/’U’
To view the processes of a specific user only, press ‘u’ and then top will ask you to enter the username.
Which user (blank for all)
Enter the desired username and hit Enter.
top - 17:33:46 up  8:21,  3 users,  load average: 2.55, 1.31, 0.81
Tasks: 246 total,   1 running, 244 sleeping,   0 stopped,   1 zombie
%Cpu(s): 11.8 us,  3.3 sy,  0.6 ni, 84.2 id,  0.0 wa,  0.0 hi,  0.1 si,  0.0 st
KiB Mem:   8165300 total,  6108824 used,  2056476 free,   198680 buffers
KiB Swap:  1998844 total,        0 used,  1998844 free.  1963436 cached Mem
Which user (blank for all) enlightened
  PID USER      PR  NI    VIRT    RES    SHR S  %CPU %MEM     TIME+ COMMAND
 1696 enlight+  20   0  440728  37728  33724 S   0.0  0.5   0:03.12 akonadi_bi+
 1705 enlight+  20   0  430304  37156  33264 S   0.0  0.5   0:03.08 akonadi_mi+
 1697 enlight+  20   0  430144  37100  33248 S   0.0  0.5   0:03.00 akonadi_co+
 1599 enlight+  20   0  504628  36132  32068 S   0.0  0.4   0:03.24 kdeconnectd
 1608 enlight+  20   0  570784  35688  29944 S   0.0  0.4   0:02.87 polkit-kde+
 1584 enlight+  20   0  781016  33308  29056 S   0.0  0.4   0:04.03 kactivitym+
10. Toggle the display of idle processes – ‘i’
Press ‘i’ to toggle the display of idle/sleeping processes. By default all processes are display.
11. Hide/Show the information on top – ‘l’, ‘t’, ‘m’
The ‘l’ key would hide the load average information.
The ‘m’ key will hide the memory information.
The ‘t’ key would hide the task and cpu information.
Hiding the header information area, makes more processes visible in the list.
12. Forest mode – ‘V’
Pressing ‘V’ will display the processes in a parent child hierarchy. It looks something like this –
top - 09:29:34 up 17 min,  3 users,  load average: 0.37, 0.58, 0.66
Tasks: 244 total,   1 running, 242 sleeping,   0 stopped,   1 zombie
%Cpu(s):  6.1 us,  2.1 sy,  0.0 ni, 91.8 id,  0.1 wa,  0.0 hi,  0.0 si,  0.0 st
KiB Mem:   8165300 total,  3968224 used,  4197076 free,    82868 buffers
KiB Swap:  1998844 total,        0 used,  1998844 free.  1008416 cached Mem
  PID USER      PR  NI    VIRT    RES    SHR S  %CPU %MEM     TIME+ COMMAND
    1 root      20   0   37844   5964   4012 S   0.0  0.1   0:01.08 systemd
  279 root      20   0   35376   4132   3732 S   0.0  0.1   0:00.22  `- systemd-journal
  293 root      20   0   44912   4388   3100 S   0.0  0.1   0:00.14  `- systemd-udevd
  493 systemd+  20   0  102360   2844   2572 S   0.0  0.0   0:00.01  `- systemd-timesyn
  614 root      20   0  337360   8624   6904 S   0.0  0.1   0:00.03  `- ModemManager
  615 avahi     20   0   40188   3464   3096 S   0.0  0.0   0:00.01  `- avahi-daemon
  660 avahi     20   0   40068    324     12 S   0.0  0.0   0:00.00      `- avahi-daem+
  617 root      20   0  166276   8788   8076 S   0.0  0.1   0:00.07  `- thermald
  621 root      20   0   15664   2496   2312 S   0.0  0.0   0:00.00  `- anacron
 2792 root      20   0    4476    844    760 S   0.0  0.0   0:00.00      `- sh
 2793 root      20   0    4364    684    604 S   0.0  0.0   0:00.00          `- run-pa+
 2802 root      20   0    4476   1672   1536 S   0.0  0.0   0:00.00              `- apt
 2838 root      20   0    7228    676    596 S   0.0  0.0   0:00.00                  `+
  630 root      20   0   28932   3128   2860 S   0.0  0.0   0:00.00  `- cron
  634 root      20   0  283120   6776   5924 S   0.0  0.1   0:00.04  `- accounts-daemon
  636 root      20   0   86160   7224   6128 S   0.0  0.1   0:00.01  `- cupsd
13. Change the number of processes to display – ‘n’
Lets say you want to monitor only few processes based on a certain filter criteria. Press ‘n’ and enter the number of processes you wish to display.
It will display a line saying –
Maximum tasks = 0, change to (0 is unlimited)
14. Display all CPU cores – ‘1’
Pressing ‘1’ will display the load information about individual cpu cores. Here is how it looks –
top - 10:45:47 up  1:42,  5 users,  load average: 0.81, 1.14, 0.94
Tasks: 260 total,   2 running, 257 sleeping,   0 stopped,   1 zombie
%Cpu0  :  3.6 us,  3.6 sy,  0.0 ni, 92.9 id,  0.0 wa,  0.0 hi,  0.0 si,  0.0 st
%Cpu1  :  3.1 us,  3.6 sy,  0.0 ni, 93.3 id,  0.0 wa,  0.0 hi,  0.0 si,  0.0 st
%Cpu2  :  7.6 us,  1.8 sy,  0.0 ni, 90.7 id,  0.0 wa,  0.0 hi,  0.0 si,  0.0 st
%Cpu3  :  9.6 us,  2.6 sy,  0.0 ni, 87.7 id,  0.0 wa,  0.0 hi,  0.0 si,  0.0 st
KiB Mem:   8165300 total,  7118864 used,  1046436 free,   204224 buffers
KiB Swap:  1998844 total,        0 used,  1998844 free.  3410364 cached Mem
15. Show/Hide columns ‘f’
By default top displays only few columns out of many more that it can display. If you want to add or remove a particular column or change the order of columns, then press f
Fields Management for window 1:Def, whose current sort field is %CPU
   Navigate with Up/Dn, Right selects for move then <Enter> or Left commits,
   'd' or <Space> toggles display, 's' sets sort.  Use 'q' or <Esc> to end!
* PID     = Process Id      PGRP    = Process Group   vMj     = Major Faults
* USER    = Effective Use   TTY     = Controlling T   vMn     = Minor Faults
  PR      = Priority        TPGID   = Tty Process G   USED    = Res+Swap Size
  NI      = Nice Value      SID     = Session Id      nsIPC   = IPC namespace
  VIRT    = Virtual Image   nTH     = Number of Thr   nsMNT   = MNT namespace
  RES     = Resident Size   P       = Last Used Cpu   nsNET   = NET namespace
  SHR     = Shared Memory   TIME    = CPU Time        nsPID   = PID namespace
  S       = Process Statu   SWAP    = Swapped Size    nsUSER  = USER namespac
* %CPU    = CPU Usage       CODE    = Code Size (Ki   nsUTS   = UTS namespace
* %MEM    = Memory Usage    DATA    = Data+Stack (K
  TIME+   = CPU Time, hun   nMaj    = Major Page Fa
* COMMAND = Command Name/   nMin    = Minor Page Fa
  PPID    = Parent Proces   nDRT    = Dirty Pages C
  UID     = Effective Use   WCHAN   = Sleeping in F
  RUID    = Real User Id    Flags   = Task Flags <s
  RUSER   = Real User Nam   CGROUPS = Control Group
  SUID    = Saved User Id   SUPGIDS = Supp Groups I
  SUSER   = Saved User Na   SUPGRPS = Supp Groups N
  GID     = Group Id        TGID    = Thread Group
  GROUP   = Group Name      ENVIRON = Environment v
The fields indicated with an asterisk (*) or bold are those that are presented in the order they occur in this list.
Use the up/down arrow keys to navigate the list, then hit ‘d’ to toggle the display of that field. Press q to return to the process list once you’ve finished.
Only the PID, USER, CPU, MEMORY, and COMMAND columns are shown in the following output.
top - 15:29:03 up  6:16,  4 users,  load average: 0.99, 0.61, 0.63
Tasks: 247 total,   1 running, 245 sleeping,   0 stopped,   1 zombie
%Cpu(s):  6.3 us,  2.0 sy,  0.2 ni, 91.5 id,  0.1 wa,  0.0 hi,  0.0 si,  0.0 st
KiB Mem:   8165300 total,  6089244 used,  2076056 free,   189272 buffers
KiB Swap:  1998844 total,        0 used,  1998844 free.  1902836 cached Mem
  PID USER      %CPU %MEM COMMAND
 1921 enlight+   9.2  3.6 /opt/google/chrome/chrome
 3078 enlight+   6.9  4.2 /opt/google/chrome/chrome --type=renderer --lang=en-+
 1231 root       5.3  1.0 /usr/bin/X :0 -auth /var/run/sddm/:0 -nolisten tcp -+
 1605 enlight+   2.8  2.5 /usr/bin/plasmashell --shut-up
 1596 enlight+   1.8  1.0 kwin_x11 -session 10d8d4e36b000144740943900000009530+
 2088 enlight+   0.9  1.7 /opt/google/chrome/chrome --type=renderer --lang=en-+
 2534 enlight+   0.8  1.7 /opt/google/chrome/chrome --type=renderer --lang=en-+
 5695 enlight+   0.8  0.7 /usr/bin/python /usr/bin/terminator
 1859 enlight+   0.2  1.2 /usr/bin/perl /usr/bin/shutter --min_at_startup
 2060 enlight+   0.2  1.5 /opt/google/chrome/chrome --type=renderer --lang=en-+
 3541 enlight+   0.2  3.6 /opt/google/chrome/chrome --type=renderer --lang=en-+
16. Batch mode
Top also supports batch mode output, which prints information in a sequential manner rather than on a single screen. This comes in handy when you need to save the top output for subsequent analysis.
Here’s a simple example that shows CPU utilization at 1 second intervals.
$ top -d 1.0 -b | grep Cpu
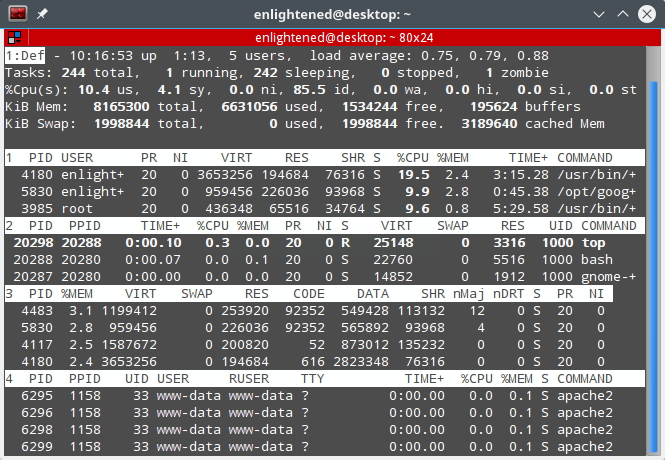
17. Split output in multiple panels – ‘A’
A different column can be used to sort each panel. To move through the panels, press ‘a’. Each panel can have a separate set of fields and sort columns displayed.
Top is an excellent command-line program for monitoring system resource utilization and process information. It’s frequently used on servers for monitoring and troubleshooting.
Try htop if you’re searching for something simpler with a nicer user experience. Htop provides an easy-to-use interface that eliminates the need to memorize keyboard shortcuts. Htop comes with onscreen instructions to help you get started.
Click here to read more useful and interesting articles.